
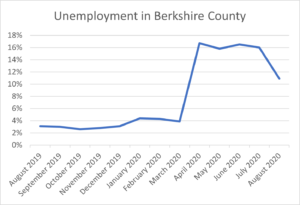
In August 2019, Berkshire County employed 65,112 people, with an additional 2,101 unemployed, resulting in a labor force of 67,213 and an unemployment rate of 3.1%. In the intervening year, COVID-19 hit. By August 2020, Berkshire County employed 54,976, with an additional 6,727 unemployed, resulting in a labor force of 61,703 and an unemployment rate of 10.9%. The number employed had dropped to a low of 48,028 in April 2020, and unemployment jumped to a high of 17.8% in June 2020. This two-month delay is likely due to people not filing initially, with an expectation of their jobs returning quickly, only to realize after two months that their layoff was going to last longer.
 The total labor force, which is the number of employed plus the number of unemployed looking for work, contracted in April to a low of 57,684. The labor force contracted for the first two months of the pandemic by over 5,000 people; however, it returned to its full size in July before starting a second contraction in August.
The number of unemployed, below 2,500 in March, rose to 9,461 in April and continued to be high through July. In August, the number of unemployed decreased substantially, but when you add in the corresponding drop in the labor force, unemployment is around 9,700 – nearly the same as August. The number of employed is improving; however, the reduction in August’s labor force, likely due to the end of supplemental COVID unemployment benefits, is concerning.
Table 1 Berkshire County Employment
| Employed | Unemployed | Labor Force | |
|---|---|---|---|
| August 2019 | 65112 | 2101 | 67213 |
| September 2019 | 62472 | 1925 | 64397 |
| October 2019 | 62524 | 1699 | 64223 |
| November 2019 | 62416 | 1773 | 64189 |
| December 2019 | 63043 | 2020 | 65063 |
| January 2020 | 61830 | 2831 | 64661 |
| February 2020 | 61568 | 2776 | 64344 |
| March 2020 | 60273 | 2432 | 62705 |
| April 2020 | 48028 | 9656 | 57684 |
| May 2020 | 50301 | 9461 | 59762 |
| June 2020 | 53387 | 10576 | 63963 |
| July 2020 | 54387 | 10325 | 64712 |
| August 2020 | 54976 | 6727 | 61703 |
Unemployment at the municipal level has seen overall improvements since the pandemic’s peak, but every community still reports higher unemployment than the previous year. Municipalities with at least 10% unemployment in August include Adams, Becket, Great Barrington, Hinsdale, Lenox, North Adams, and Pittsfield, with the highest being Lenox at 14.0%.
Impacts of COVID continue to occur across industries and occupations. All industrial sectors are seeing an increase in unemployment claims since 2019. Accommodations & food services had the highest number of unemployment claims in August of 2020 with 1,218, followed by health care (816), retail trade (723), and other services (601). All occupations are also seeing an increase in unemployment claims since 2019, with food preparation & serving related seeing the highest number of claims at 1,166 in August 2020. Other occupations seeing a large number of claims include office & administrative support (631), transportation & material moving (537), management (504), and sales & related (501).
All data in this article provided by the Massachusetts Department of Unemployment Assistance.
For more information, contact Mark Maloy.